Tracing my journey into Opentelemetry with Rust
/ 17 min read
Disclaimer: This is not a tutorial. This is an informative story that I want to share with my zoomer friends. Therefore the style of writing is more casual and less formal.
Have you ever wondered — “Oh, my app is slow, and I don’t know why. If only there was an easy way to have observability?”. Well, I wondered and pondered for a long time, too.
I assume you are unfamiliar with OpenTelemetry, tracing, and all related things. Just like I am (was?). Therefore, I will provide insights on how I got to where I am now. I will also provide you with some resources that I found helpful along the way. This is not a tutorial but rather a trace of my journey 💁
Background
I have a few Rust apps running in production. Usually, Rust is performant enough that I don’t need to worry about performance and nobody cares if I .clone() all the Strings. But I have some outlier projects where performance is king and the product’s selling point. And there have been a few complaints that ”yo bro, the app is slow as fk every now and then”. And I am like, ”yeah, I know, but I don’t know why”. So I decided to do something about it. My naive attempts looked like this:
let then = Utc::now();
// ... brew a coffee
let now = Utc::now();
let duration_ms = (now - then).num_milliseconds();
tracing::debug!(duration_ms = duration_ms, "wow that was slow");
Of course, this works if you know where to look. But my app is 40k LOC Rust codebase. I have logs, but when you have a lot of logs, good luck finding a needle in a haystack. You either log too much or too little. I need to figure out where to look. I need to find out where the slow parts are. I am still figuring out under what conditions the slow features get triggered. The app is complex enough that it takes work to reproduce the issue locally (as in more work than I can afford in the evenings after my day job). I needed more insight into the app that’s running in production. I need the ability to do post-mortem analysis. Luckily, forefathers of web development have already solved this problem - OptenTelemtry -, but no one bothered to tell me about it earlier… So I had to rediscover fire 🔥 myself.
What is OpenTelemetry?
Okay, so let’s start with the “Wikipedia” definition:
OpenTelemetry is a collection of APIs, SDKs, and tools. Use it to instrument, generate, collect, and export telemetry data (metrics, logs, and traces) to help you analyze your software’s performance and behaviour.
In essence, the idea is straightforward. Your application, every now and then, calls an SDK/API to send some meta information about how it’s running. The important thing is that you have the data. Libraries like Rust opentelemetry and tracing provide you with the tools to annotate your code and send the data to the place of your choosing (a consumer of your “opentelemetry” data). OpenTelemetry is just a standard way of packet format and API. There are many consumers of this data. For example Jaeger, Zipkin, AWS X-Ray, Datadog, New Relic, Dynatrace, Prometheus, Grafana. Most of them hide behind a paywall, but some are free. Also, the juice of it is usually hidden behind terms like “Distributed tracing”. I will talk about the services later (not all of them are like the others of their offerings either).
What are Traces
I will speak in layman’s terms of what traces are to me. Traces are a way to see how your application behaves at runtime with the ability to use external tools to see how it looks visually.
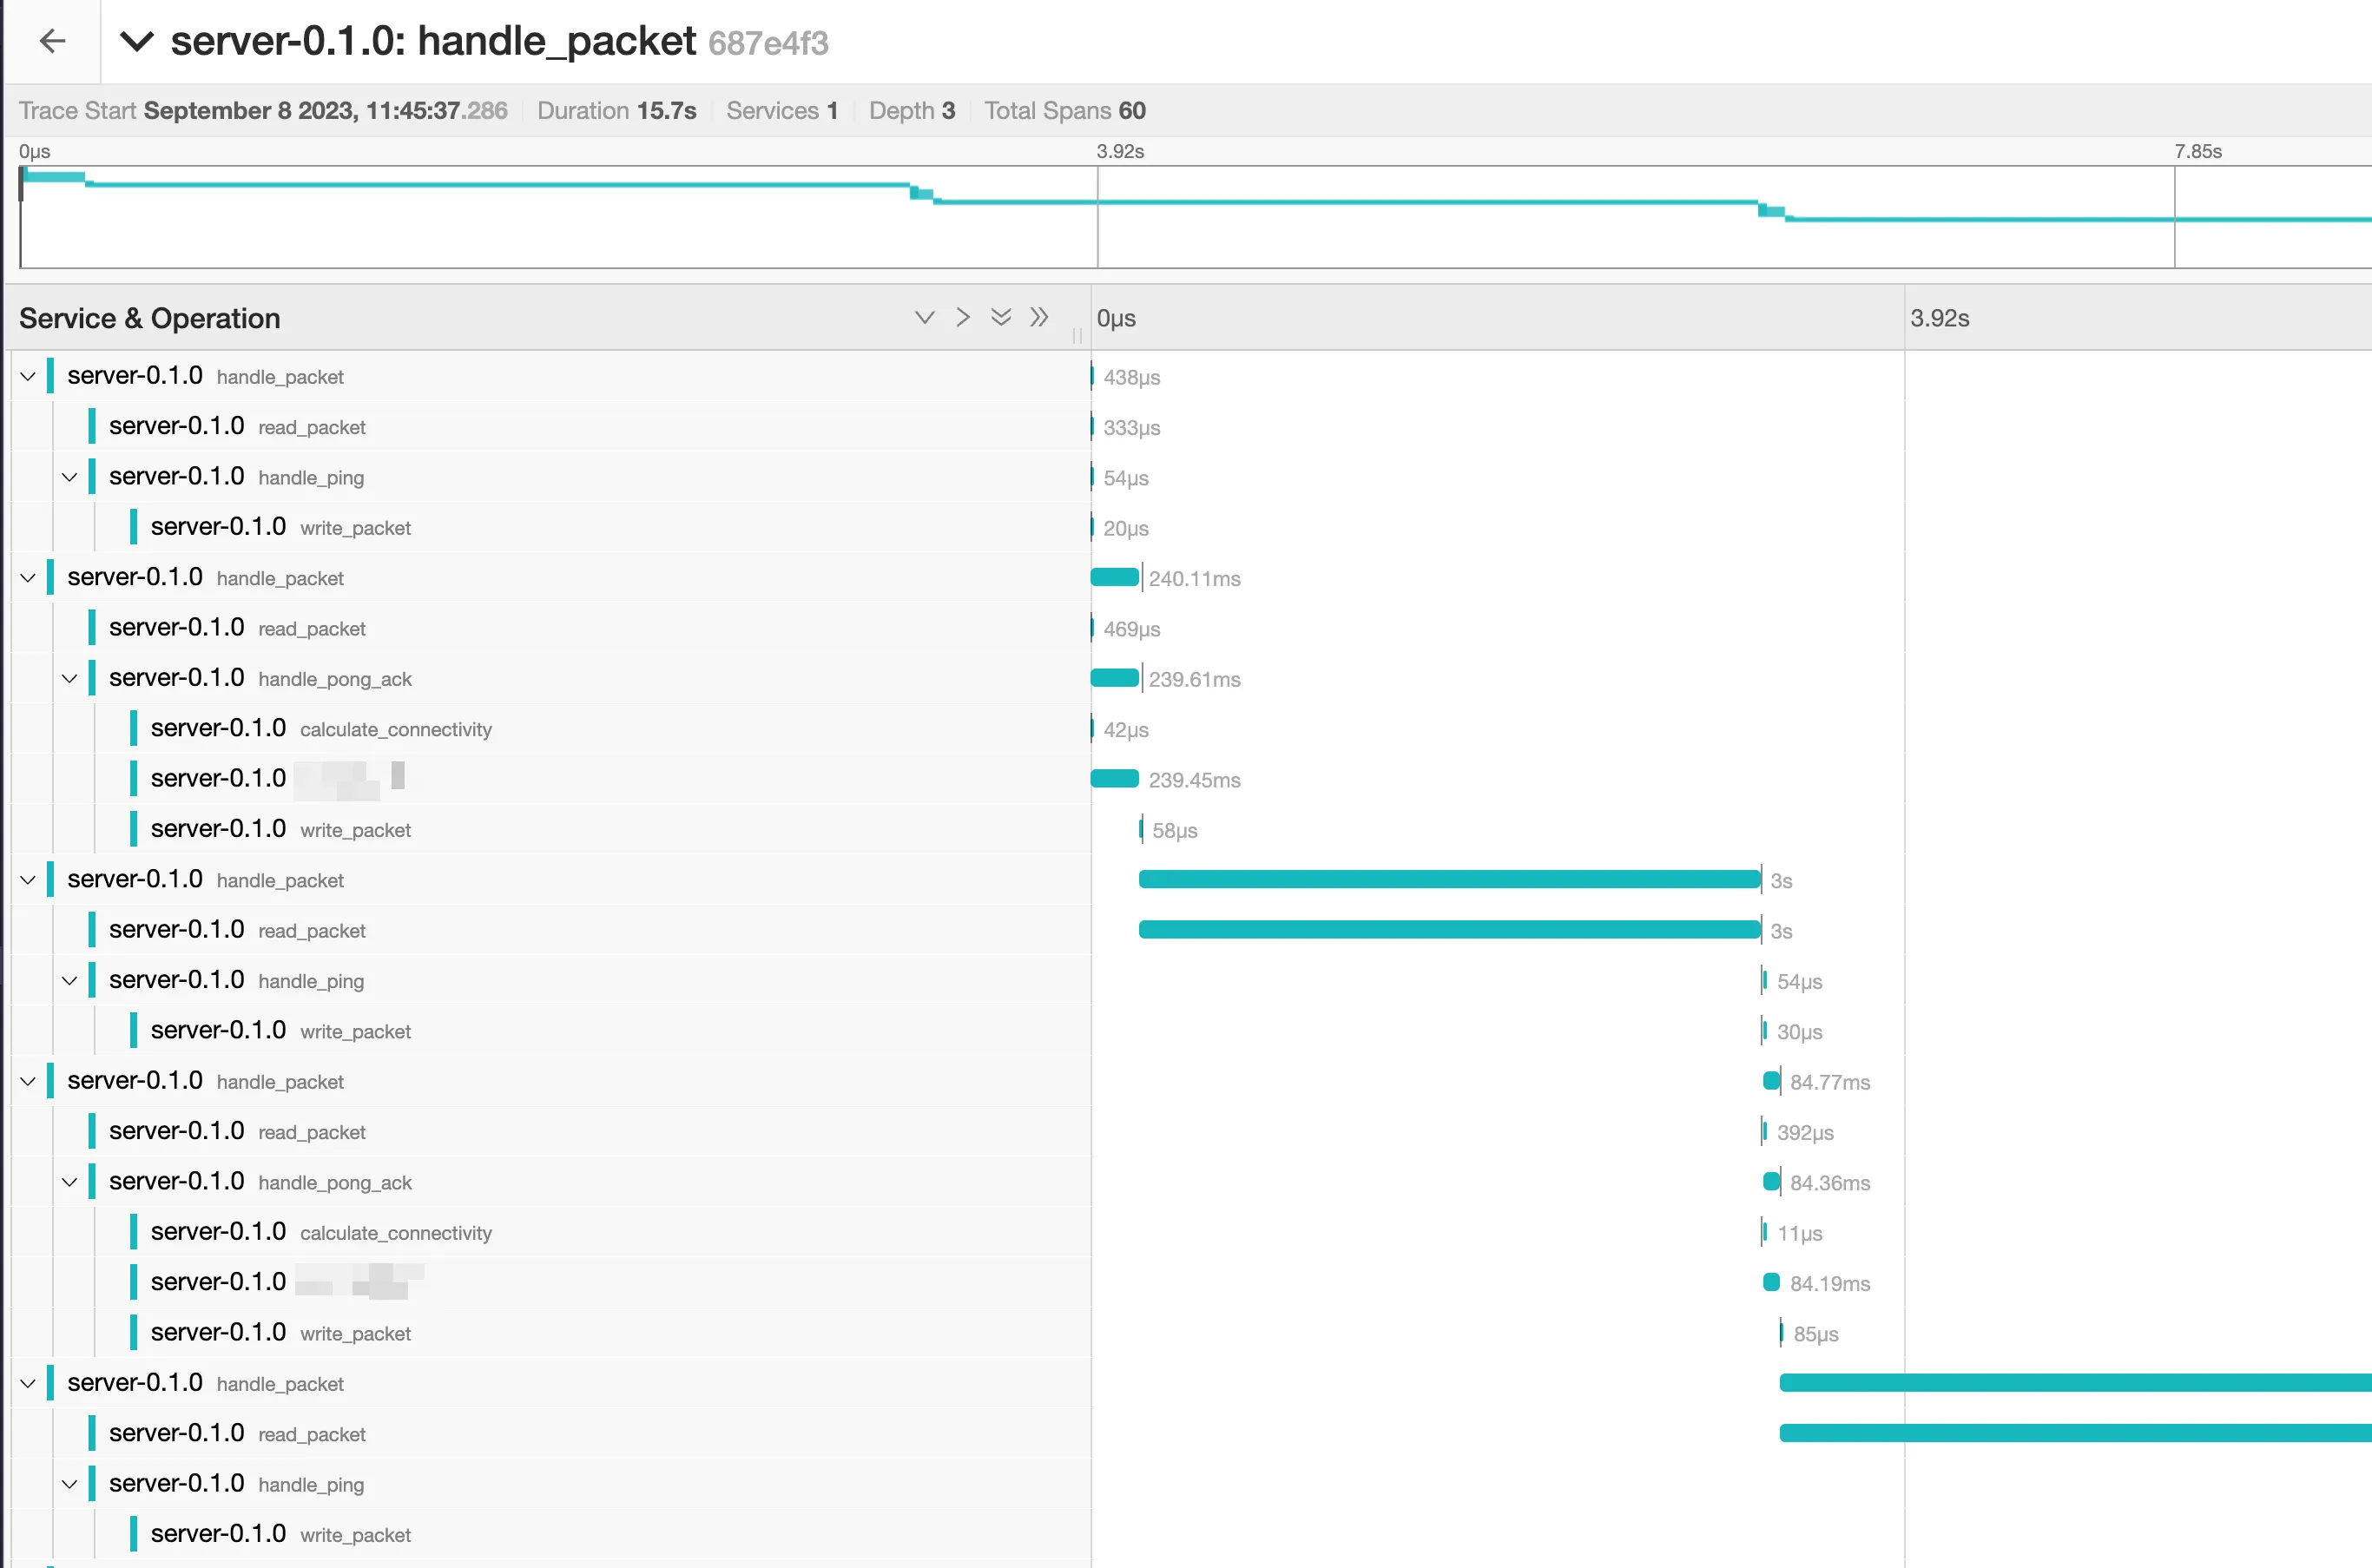
The data usually looks like this:
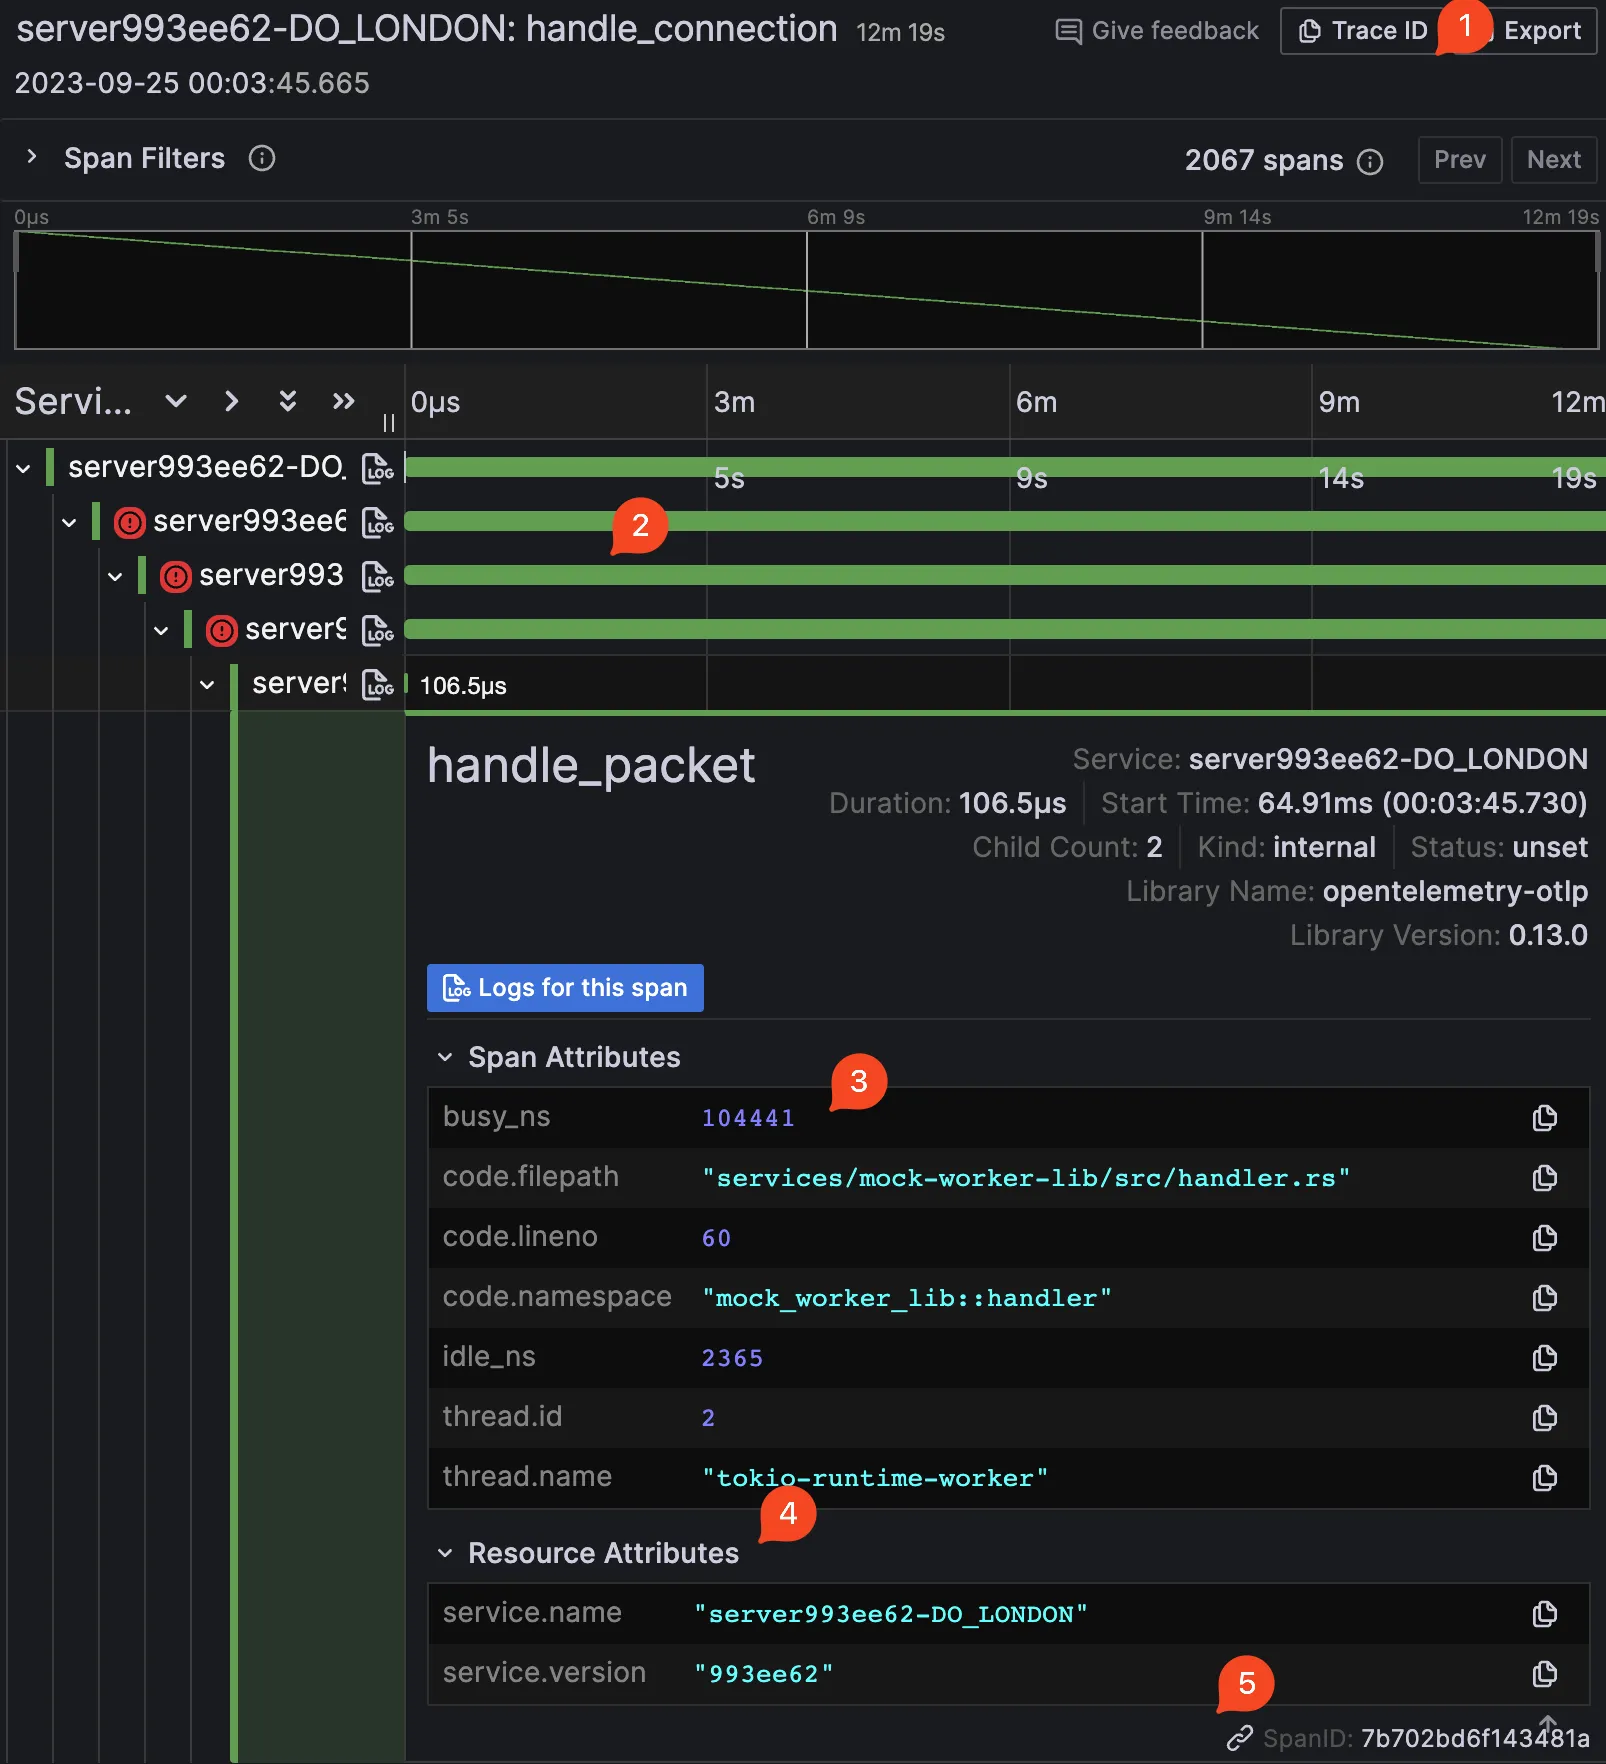
(The picture has little numbers attached; I will explain their meaning.)
- Each trace is identified by a unique ID. This is useful if you have a distributed system and want to see how a request propagates. Because they (the trace IDs) can be sent across services. Each trace ID can be viewed as an “entry point of spans”.
- Each trace is made up of spans. Spans are like a “subtrace” of a trace. They are usually used to represent a single operation. For example, a single HTTP request or a single database query. Spans can be nested. For example, a single HTTP request can have a span for the HTTP request and a span for the database query due to the HTTP request.
- Each span contains attributes that are useful for debugging. For example, the name of the span, the duration of the span, the status of the span (success, failure, etc.), and other custom attributes you can add yourself. The span can also contain a list of events (aka log entry) that happened during the span (not visible in the screenshot 😝).
- It can also contain extra metadata about the service. I don’t know if this correlation is done by the consumer or producer of the data. But it’s nevertheless helpful to know which service the span belongs to.
- Each span itself is identified by a unique ID.
What are Logs
This should be self-explanatory. Logs are a way to see what your application is doing at runtime. Usually, you can filter by log level, and by service. In an ideal scenario, the logs are structured, for example, in JSON format. 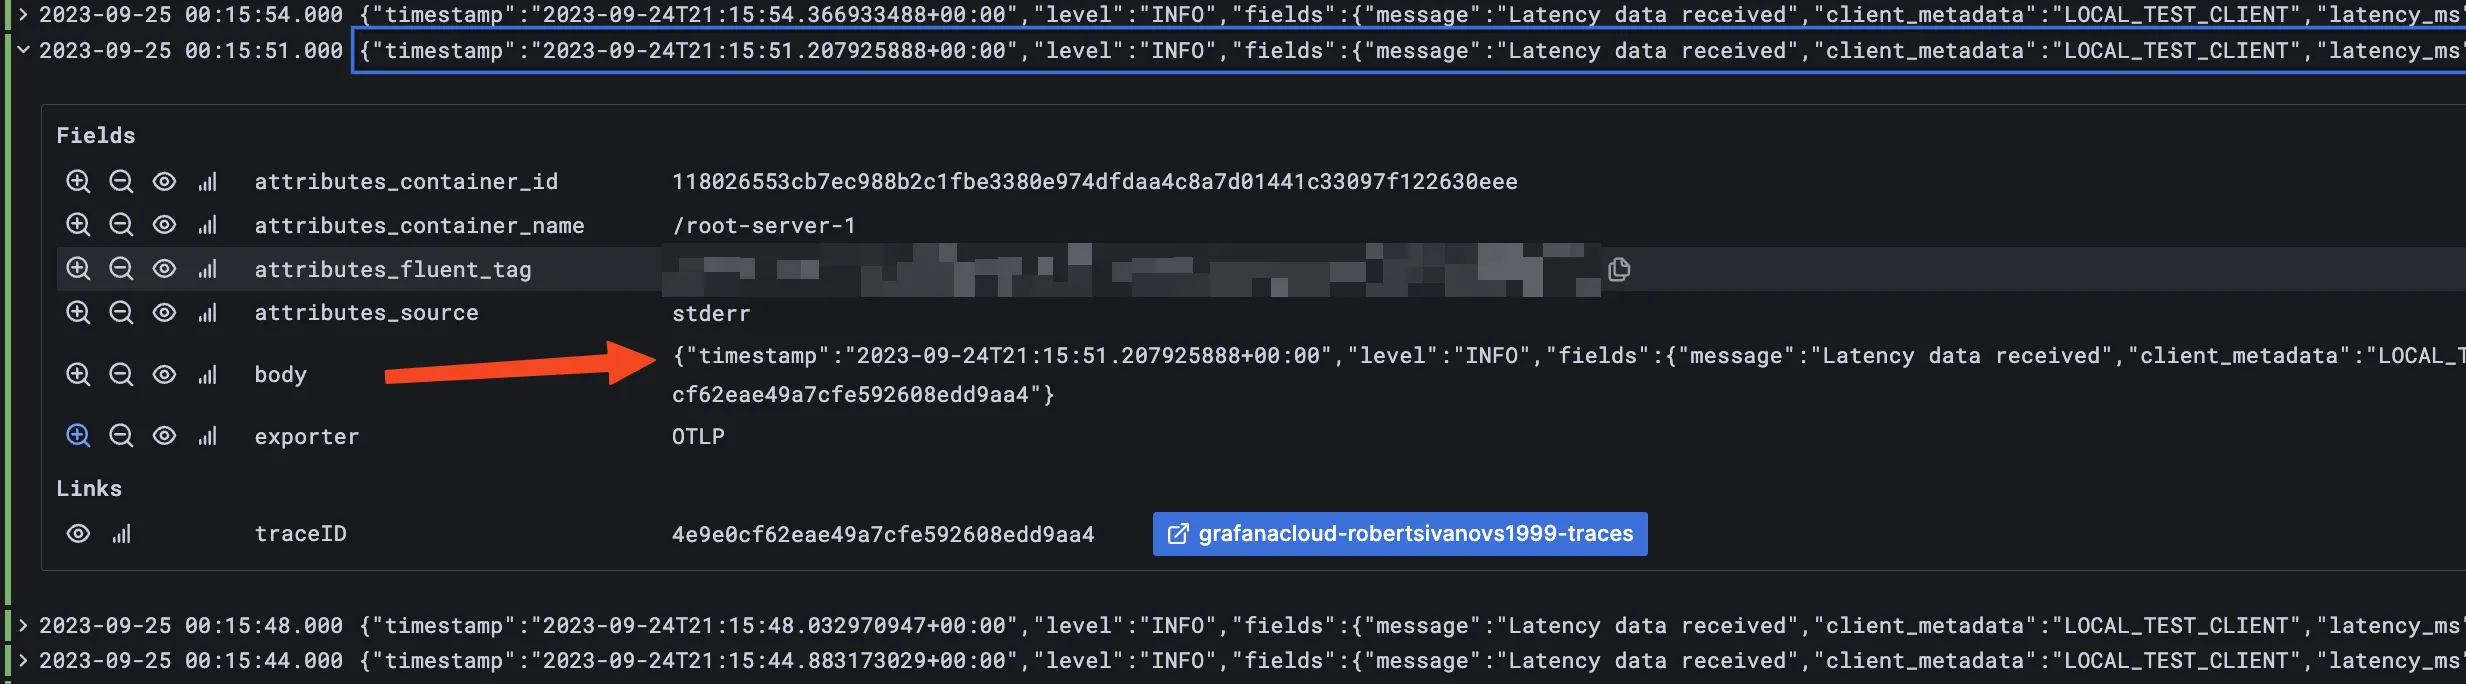 If you use an intelligent enough OpenTelemetry consumer service, it should be able to correlate the logs with the traces. It usually requires some extra configuration, but it’s worth it — see errors in the logs, and you can jump into traces to see the full context of the execution flow.
What are Metrics
Metrics are just a way to see how your application is performing over time by being able to write a “histogram” entry whenever you please. I did not research metrics, so this paragraph stops here. They probably work if you try hard enough and read the docs.
How to instrument your code
You may be aware of what OpenTelemetry is and what it can do for you. Now, let’s talk about how to instrument your code (fancy way of saying “make it send some data”). I will be using Rust as an example. Good luck exploring the other (aka lesser) languages and their SDKs. First, you will need the tracing crates to do anything:
tracing = "0.1"
tracing-subscriber = { version = "0.3", features = [
  "env-filter",
  "fmt",
  "tracing-log",
  "json",
  "valuable",
  "tracing",
] }
There are more dependencies like tokio, reqwest, and other stuff, but remember that this is not a tutorial. Now, with tracing inside our code, we can do something like this:
// 👇 this is where the magic happens!
#[tracing::instrument(skip_all, err)] // skip_all means skip all arguments, err means that we want to log the error
async fn handle_ping<T>(client_time: DateTime<Utc>, send: &mut Pin<&mut T>) -> eyre::Result<()>
where
    T: AsyncWrite,
{
    let response = ServerMessage::Pong { client_time, server_time: chrono::Utc::now() };
    tracing::info!("Logging something that no one will ever read");
    send.write_packet(&response).await?;
    Ok(())
}
This code shows how long it takes to write a packet through the async writer. We can also see that we are logging something. I want to highlight something nasty that you might encounter. If you are using async code, and you don’t want to use the macro for your async calls then it’s time for some gymnastics (here’s the link to docs):
async fn my_async_function() {
    let span = info_span!("my_async_function");
    async move {
       // This is correct! If we yield here, the span will be exited,
       // and re-entered when we resume.
       some_other_async_function().await;

    }
      // instrument the async block with the span...
      .instrument(span)
      // ...and await it.
      .await
}
God works in mysterious ways, and that’s just something to be aware of. I just split my stuff into smaller functions and use the tracing::instrument macro. I have not yet encountered a case where the gymnastics 👆 would be prettier to look at than extra function splits.
But we need to find out where the logs are going. Now, we need to actually send the data somewhere. In “standard” opentelemtry setups, there’s an entity called a “collector”. It’s a service that receives the data from your services and then sends it to your chosen place. For example, you can send the data to a local file or a remote service. This is the how the high level flow looks like (source):

There are a bunch of these collectors out there. Some are better, some worse, but I cannot really judge between them because of the lack of XP in this arena. Therefore, I use the default one available that’s maintained by the OpenTelemetry team (?) (I also tried out the Grafana Agent and the DataDog agent):
# docker-compse.yaml for spinning up the collector locally
version: "3"
services:
  otel-collector:
    image: otel/opentelemetry-collector-contrib:latest
    env_file:
      - .env
    volumes:
      # Config file examples are available online for almost every service that you might desire.
      # This is also the part that is responsible for sending the data to the place of your choosing.
      - ./otel-collector-config.yaml:/etc/otel-collector-config.yaml
    command: ["--config=/etc/otel-collector-config.yaml"]
    ports:
      - 4317:4317 # OTLP gRPC receiver
      ...
To communicate with this collector, we need to configure the OpenTelemetry SDK. I will show you how to do it with the otlp crate. Almost every cloud provider has their own packet formats (be it json schema or the protbuf packets), GRPC and HTTP endpoints and of how they ingest data. OTLP is the standard packet format that is supported by most of the collectors and the services directly. So, you can keep your code the same if you want to switch from one provider to another. And because most of them are batshit expensive (at least for someone trying to do some indie-hackerish development), having this ability to jump ships is very important. So here’s how you configure the SDK:
Add this monstrosity to your Cargo.toml:
opentelemetry-semantic-conventions = "0.12"
opentelemetry_sdk = {version = "0.20", features = ["rt-tokio"]}
opentelemetry = { version = "0.20", default-features = false, features = [
  "rt-tokio",
] }
opentelemetry-otlp = { version = "0.13", default-features = false, features = [
  "trace",
  "tokio",
  "logs",
  "metrics",
  "grpc-tonic",
] }
tracing-opentelemetry = { version = "0.21", default-features = false, features = [
  "metrics",
] }
tracing-serde = "0.1"
serde_json = "1"
Now you are ready for the transition that will transform you from a stdout logger child into a full-blown opentelemetry adult.
Like and Subscribe (to my traces)
Now we need to configure the tracing subscriber. This will actually send the data to the place of your choosing.
Inside the Rust code, there are 2 things your main function needs to do:
- Actually registering a “subscriber” to the traces that your application will emit throughout its lifespan.
- Configuring the subscriber to send the data to the collector.
// main.rs
// Initialize tracing
telemetry::init_telemetry(&configuration.tracing_endpoint);

// Somewhre else
mod telemetry {
  ...

  pub fn init_telemetry(exporter_endpoint: &str) {
    let tracer = otel_tracer(exporter_endpoint);
    let subscriber = Registry::default();
    let tracing_layer = tracing_opentelemetry::layer()
      .with_tracer(tracer);
    let level_filter_layer = EnvFilter::try_from_default_env()
      .unwrap_or(EnvFilter::new("INFO"));
    let output_layer = tracing_subscriber::fmt::layer()
        .with_writer(std::io::stderr);
    subscriber
        .with(tracing_layer)
        .with(level_filter_layer)
        .with(output_layer
          .json()
          .with_current_span(true)
          .event_format(Json)
        )
        .init()
  }

  fn otel_tracer(exporter_endpoint: &str) -> trace::Tracer {
     ...
      opentelemetry_otlp::new_pipeline()
          .tracing()
          .with_exporter(exporter)
          .with_trace_config(trace_config())
          .install_batch(opentelemetry::runtime::Tokio)
          .expect("Error: Failed to initialize the tracer")
  }
}
So, there are a few essential things that I want to highlight here. The tracing subscriber is composed of layers applied to the subscriber. The order of the layers is critical. The first layer is the one that is used first, and the last layer is the one that is applied last. The order of the layers is essential because the layers can override each other. In our case, the idea is simple: a layer for sending data to the otlp collector, a layer for filtering log levels, and a layer for printing the “normal” logs to the stderr.
Logs
Trying to get logs working was a pain. I am not sure if it’s because I am using the tracing-subscriber crate or because I am using the tracing-opentelemetry crate. A bro died internally trying to get this shit working. It is pretty ironic because, at the very beginning, all I had were logs 😂. But I had to do some extra gymnastics to get it working.
The promise of OpenTelemetry was that “you can send logs, traces and metrics”, and they would all work and appear where you want. Well, as it turns out, there are different “levels” of support for each of those functions, and the support for Rust is lacking 🥲.
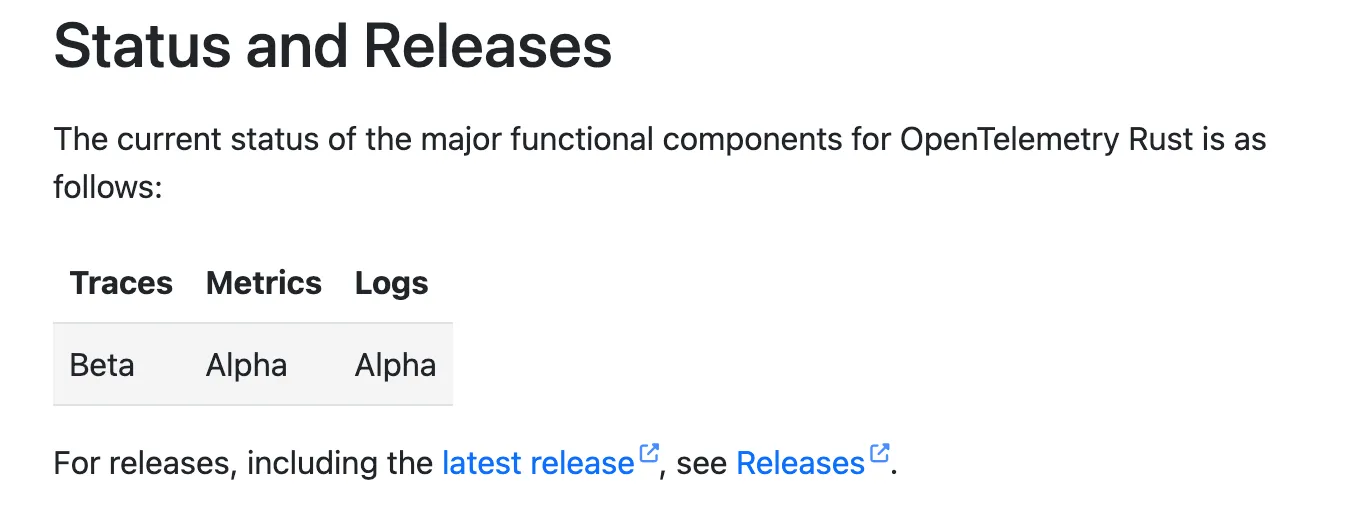
I interpreted the feature as “You can send your logs through the otlp connection rather than processing the stdout”, which is the promise but not what’s delivered. Sadly, C++ has stable support for all features, making the Rust dev seethe. At least Go is not in a better shape.
So what does this mean for you, the average OpenTelemetry enthusiast? In my case, I tried configuring the available telemetry crates to collect the logs, but many problems arose along the way with no real success. Here’s a list in no particular order:
- lack of docs showing how logs through otlp can be accomplished. I should have taken this as a hint that the technology is not there yet.
- there’s no
logs()pipeline support within thetracing_opentelemetrycrate. - There’s
logssupport to create an exporter for logs inside theopentelemetry-otlpcrate link here to the code. I got a proof of concept ready where I had the “logs” stack pipeline integrated with the subscriber. For some reason, this logging stack decided to “eat up” all the logs when attached to the subscriber. I never got to see anything in my terminal nor in my collector. So, I was left with code that acted as a black hole from which logs were unable to escape. I am still looking into where the logs actually went…
So what did I do? I just used the tracing-subscriber crate to output the logs to the stderr. Then I set up docker logging-driver to write the logs to fluentd, which would forward them to fluent-bit, which in turn was forwarding them to the otlp-collector which was then forwarding them to the “end service”. I am a frequent enjoyer of the “hot potato” game, as you can see. It could be better, but it works.
And as a student of ”Done is better than perfect mantra”, I’d like to classify this as DONE ✅. Here’s how I did it:
version: "3"
services:
  fluent-bit:
    image: fluent/fluent-bit:latest
    volumes:
      - ./fluent-bit.conf:/fluent-bit/etc/fluent-bit.conf
    depends_on:
      - otel-collector
    ports:
      - 24224:24224 # fluentd forwarder

  server:
    # this is my app 👇
    image: ghcr.io/roberts-ivanovs/http3-server:latest
    ports:
      - 4433:4433/udp
    environment:
      - RUST_LOG=INFO
      - ...
    logging:
      driver: fluentd
      options:
        fluentd-address: localhost:24224
        tag: "{{.ImageName}}/{{.Name}}/{{.ID}}"
    restart: always
    depends_on:
      - fluent-bit
Also, this works for my setup because I am using docker-compose. If I were using Kubernetes, the code would be different, but the general flow of data will remain the same.
An important thing I want to highlight regarding logs is that most services allow you to “connect” traces with logs and vice versa. But there’s a catch: how can the end consumer of the data know which log is associated with which trace and span? Well, the answer is simple: add the trace ID and span ID to the log entry. Sadly, this is not done automatically by the tracing library - here’s an open issue regarding this. Some Chad programmers out there have done the hard thinking for Grug brains like you and me, so here’s a link to the code that you need to yank into your project to make this work. I added and removed some minor things for my own version. Still, the general idea should seem clear to anyone familiar with Rust.
How to view whatever you instrumented
At this point I have a running collector, and an application that sends data to it. Now, I need to configure the collector to send the data for final consumption. So, I went into a small research spree. In the ideal scenario, I wanted to avoid hosting anything myself. I wanted a free (or cheap) service that would allow me to send my data to it. I found a couple of services that I will list here:
- Grafana: This is the solution I ended up sticking with at the end. Their very generous free tier allows you to spin up your services in just a few clicks and use it without problems, no credit card needed. The only confusing thing was the UI. I had to learn and understand the different components of Grafana, how they interact (Loki, Tempo), what the f are dashboards, etc. Also, because it’s all based on open-source tooling, if I ever decide to self-host, I can spin up the whole Grafana stack.
- DataDog: I tried this out, and it seems to be considered one of the best and most mature services. Awesome user experience. I was up and running in no time. It’s not free, and it’s not cheap. It’s, in fact, so expensive that there are alternative products whose entire marketing campaign revolves around “we are DataDog without 90% of the cost — just 199$ per month!” —
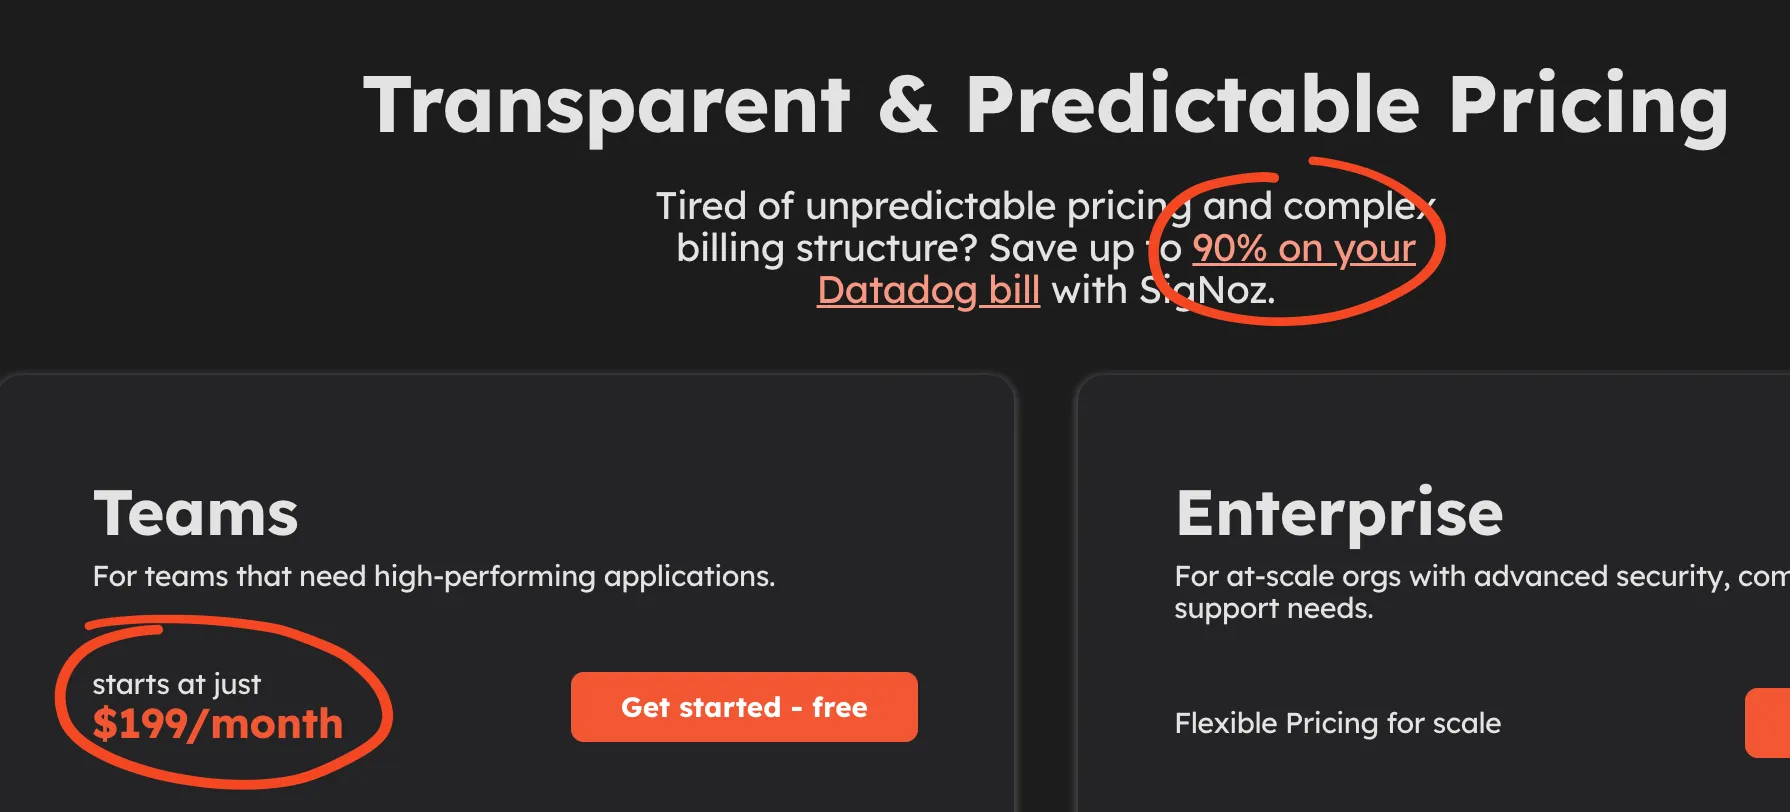 And numerous discussions on Reddit trashing the obscure pricing model just told me that I need to run away from this service and pray to god they don’t start charging me for the free trial.
 - Jaeger: I liked the simplicity and the UI. Awesome as a self-hosted option
 But it only works with traces and not logs, and it does not have a cloud service. Afaik, it can work together with Grafana in the sense that you can expose the endpoints of Jaeger and send traces there, and Grafana can hook into Jaeger storage (?) to read the data and display it on its dashboards.
 - ELK: Loved how the UI looked like (based on the screenshots). Hated the expensive cloud pricing model.
- HyperDX: I guess that I just cannot be pleased, can I? First of all, the pricing model seemed reasonable for my scale. Concrete “$20 and you get this and that” seemed great to me. Overall, the product seemed nice, but I hated the UI. I like the whole aesthetic vibe that they have going for them, but actually, just looking at the traces and exploring the data seemed unintuitive and difficult. It’s just a matter of getting used to it, but I did not want to invest time into it
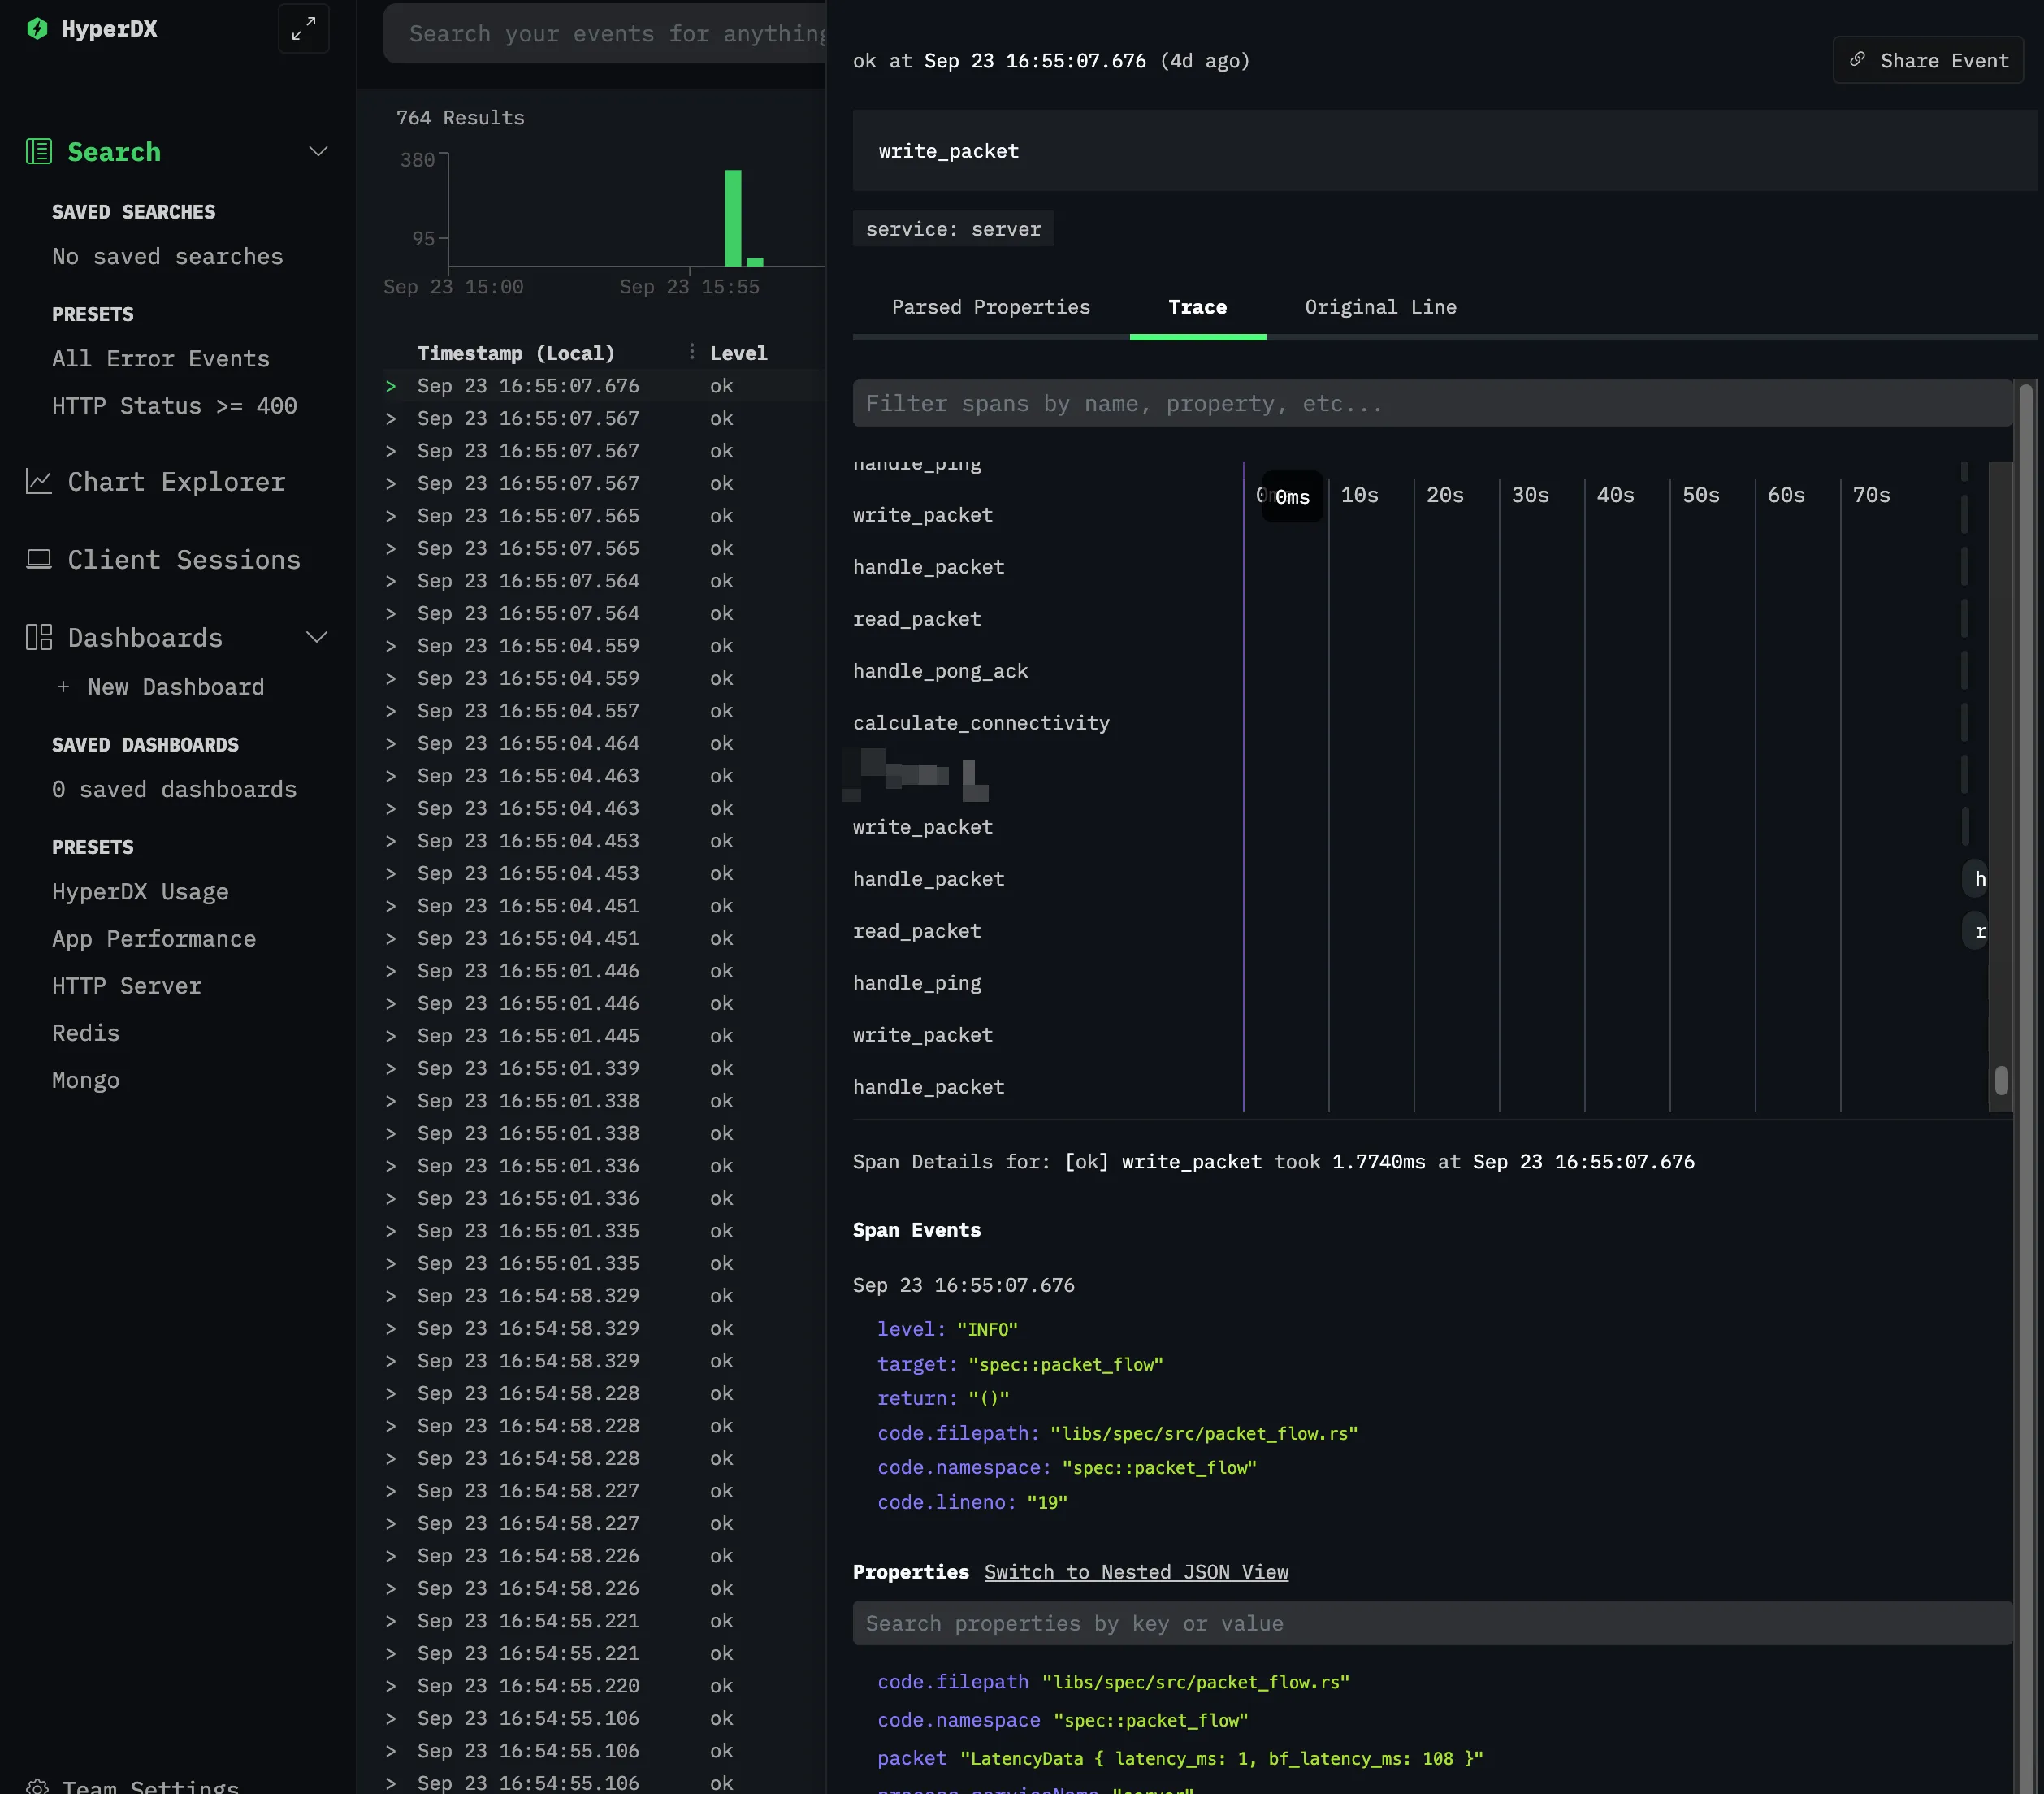 Especially when something like “I have Grafana knowledge” can be a more marketable skill than “I have HyperDX knowledge”.
 - Dynatrace: The pricing model was just as scary as DataDog; all the prices seemed small, but then you start calculating and figure you’ll go bankrupt in 2 weeks. I did not even bother trying it out. Like I am into this whole R&D and small project development, I am still trying to figure out how many traces I will send to you in a day for a product with 3 users. I don’t want to be charged for the unknown. Sounds like a me problem, but I’d rather not have this headache. Grafana lets me operate in peace.
Honorable mentions of products in the space: Logz, Stackify, AppOptics, Atatus and probably dozens more
Conclusion
So the big question is — did I solve the business problem and find the performance bottleneck? Well, I did not. The client said that everything is now working fine, and there are no problems with performance anymore 🙃

But I am now in a position where I can actually see what’s going on. I can see the traces. I can see the logs. I can see the runtime performance of my application. At any point I can see where and how shit hit the fan (as it inevitably will). So in terms of the robustness of the software and having introspection into it’s runtime, I am in better shape than I was before, and this is going to be a toolset I’ll bring into new future greenfield projects, too.